Monitor cloud-based instances and VMs in SAM
This section offers an overview about monitoring your cloud-based infrastructure in SAM. For details, see Monitor cloud instances and VMs in the SolarWinds Platform Administrator Guide.
To support hybrid environments, the SolarWinds Platform can retrieve data from the AWS EC2 and Microsoft Azure cloud service platforms to track availability, performance, applications, and more for instances and VMs. Examples of data gathered include status, storage capacity, and memory usage.
To retrieve status and metric data for monitored clouds (cloud metrics), the SolarWinds Platform sends API requests to the cloud service. The first 1 million requests per month are free, extra requests are charged by your cloud provider.
By combining SAM with the cloud infrastructure monitoring capabilities built into the SolarWinds Platform, you can:
- Manage hybrid environment metrics and status through a single console. Displaying on-premises, virtual, and cloud systems together helps you compare performance, locate bottlenecks, and better plan capacity and resource allocation.
- Dynamically monitor cloud instances and VMs to better handle resource churn during provisioning. Instances and VMs can be removed as needed to support expanding environments or performance peaks.
- Determine usage trends and troubleshoot issues. Metrics captured over time provide historical references to track trends for resource consumption (such as CPU spikes and lulls) so you can determine when those trends become issues.
- Use cloud monitoring data, SolarWinds Platform alerts, and the Performance Analysis dashboard (PerfStack) to review historical performance and pinpoint when significant usage changes began to trigger issues.
Several SAM features support cloud infrastructure monitoring:
- Use SAM API Poller templates to monitor metrics for Azure, Microsoft 365, and SolarWinds products such as AppOptics.
- Use SAM application monitoring templates to poll cloud-based applications and services for specific metrics beyond the basic metrics gathered by cloud service APIs, such as OS and memory metrics.
- Monitor hardware health for Nutanix clusters, along with child Hyper-V and VMware nodes.
- Monitoring container services for Docker, Kubernetes, and Apache Mesos.
- Display cloud instance/VM details in AppStack for quick troubleshooting across your environment.
- Develop and deploy custom script monitors for PowerShell, Nagios, Linux/Unix, and Windows.
How do I configure it?
- Review the following resources:
- Configure your AWS or Microsoft Azure cloud account to interact with the SolarWinds Platform.
- Gather credentials in your cloud console.
- Add the first cloud account to the SolarWinds Platform Web Console.
- If you plan to use SolarWinds Platform agents, WMI, or SNMP to poll for metrics beyond those gathered by cloud service APIs (for example, metrics retrieved by SAM application monitors), configure cloud instances/VMs as managed nodes. See Manage your cloud in the SolarWinds Platform as a node.
If you exceed recommended cloud monitoring limits and receive a 503 Service Unavailable error when adding Azure accounts, click here for a workaround.
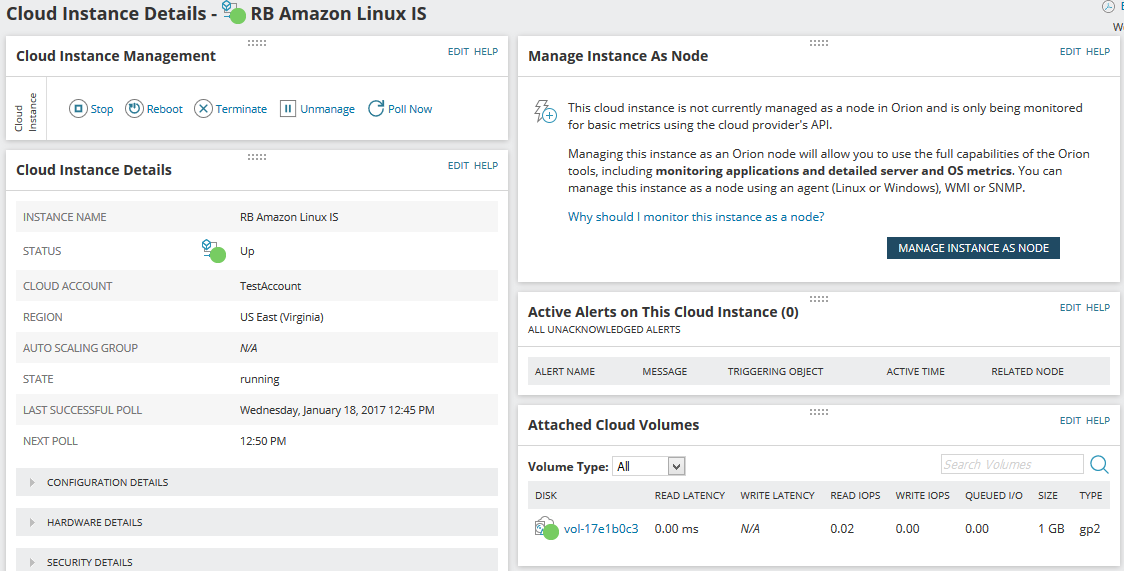
What does it look like?
After your cloud account is configured and polling begins, you can explore cloud instances and VMs on the Cloud Summary page.
To learn more about cloud monitoring, see:
- SolarWinds Platform in the Cloud: Hybrid IT User Stories and Best Practices (video)
- SolarWinds Lab #82: Quicker Azure Monitoring (video)
- Troubleshoot cloud monitoring with PerfStack (SolarWinds Platform Administrator Guide)