Microsoft Azure SQL Server Database Elastic Pool API poller template
Use this SAM API poller template to monitor Microsoft Azure SQL Server Database Elastic Pool performance and statistics counters, including percentage utilization.
Links and screenshots herein are attributed to © 2021 Microsoft Corp., available at docs.microsoft.com.
Prerequisites
-
Use the following parameters to specify the API endpoint in the request URL:
- ${SUBSCRIPTION_ID}
- ${USERGROUP_ID}
- ${SERVER_ID}
- ${ELASTIC_POOL_ID}
Use the following example to help locate values in Azure:
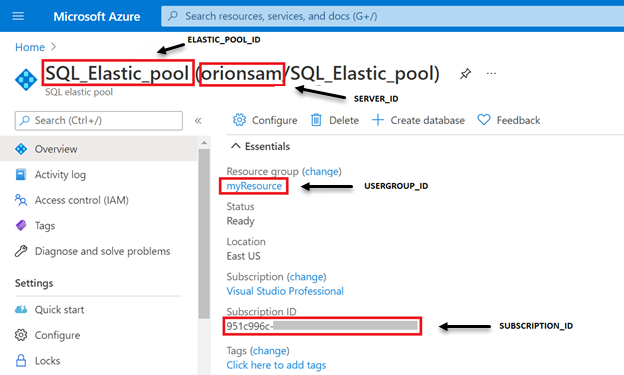
-
Configure OAuth 2.0 Azure credentials with the following values:
- Scope:
https://management.azure.com/.default - Access Token URL:
https://login.microsoftonline.com/{TENANTID}/oauth2/v2.0/token
Although "(optional)" appears next to the Scope field in the UI, this value is required for API pollers based on this template.
- Scope:
-
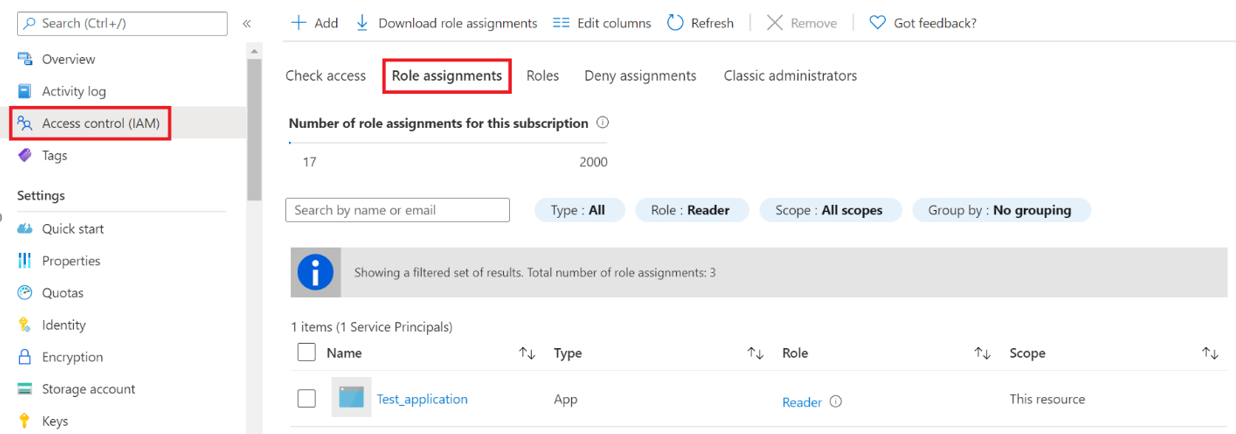
The SQL Server has access control to the Application with at least the Reader role.
Notes
- Default thresholds are not set for this template.
- You can add the following metrics to this template:
- xtp_storage_percent
- cpu_limit,cpu_used
- sqlserver_process_core_percent
- sqlserver_process_memory_percent
- tempdb_data_size
- tempdb_log_size
- tempdb_log_used_percent
- allocated_data_storage
- allocated_data_storage_percent
- Here is a request example:
https://management.azure.com/subscriptions/6a4208fe-5200-417e-9365-99781c6133c3/resourceGroups/Monitoring/providers/Microsoft.Sql/servers/jr-server/elasticPools/JR-POOL/providers/microsoft.insights/metrics?interval=PT1H&metricnames=cpu_percent,physical_data_read_percent,log_write_percent,storage_percent,workers_percent,sessions_percent,storage_limit,storage_used&aggregation=Average&api-version=2019-07-01
Available metrics
CPU percentage
The average compute utilization in percentage of the limit of the given SQL database pool during the time period specified as the polling frequency.
Unit: Percent
Data IO percentage
The average I/O utilization in percentage based on the limit of the given SQL database pool during the time period specified as the polling frequency.
Unit: Percent
Log IO percentage
The average write resource utilization in percentage of the limit of the given SQL database pool during the time period specified as the polling frequency.
Unit: Percent
Storage percent
The current average elastic pool storage used percentage for the given SQL database pool during the time period specified as the polling frequency.
Unit: Percent
Workers percent
The average concurrent workers (requests) in percentage based on the limit of the given SQL database pool during the time period specified as the polling frequency.
Unit: Percent
Sessions percent
The average concurrent sessions in percentage based on the limit of the given SQL database pool during the time period specified as the polling frequency.
Unit: Percent
Storage limit
The current average elastic pool storage limit setting for the given SQL database pool in MB during the time period specified as the polling frequency.
Unit: Bytes
Storage used
The average storage used by the pool, in bytes, during the time period specified as the polling frequency.
Unit: Bytes