Monitor services delivered by F5® BIG-IP® load balancers in NPM
A load-balanced service is comprised of many components that work together. In the Balancing Environment widget, you can browse all of these components and their relationships and status.
- Go to My Dashboards > Network > Load Balancing.
The page shows an overview of your load balancing environment.
At the top, you can see your load balanced services. Below Services, there are Global Traffic Managers (GTMs) that host the services. The GTMs send users to your Local Traffic Managers (LTM). Your LTMs present virtual servers which are made up of pools, and individual pool members hosting the content.
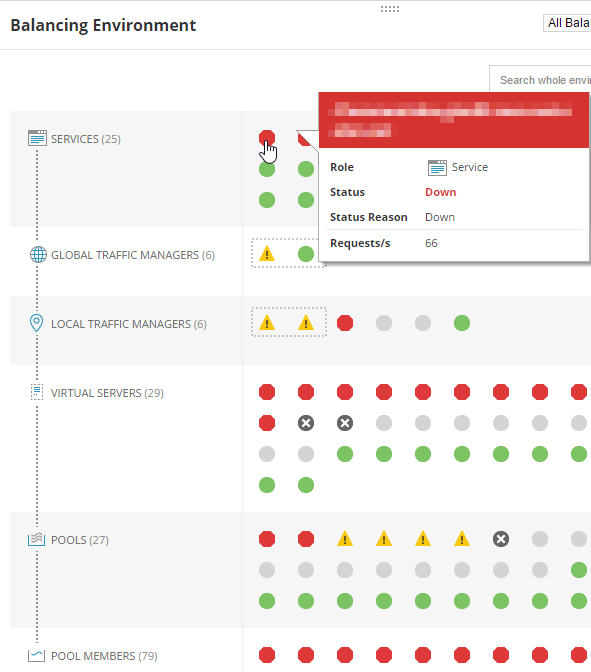
Dotted rectangles highlight high availability (H/A) clusters.
- Point to a service to review the tooltip.
- To see more detailed information about the component, such as the number of concurrent connections and the load balancing algorithm, click the service and select Display Details Page.
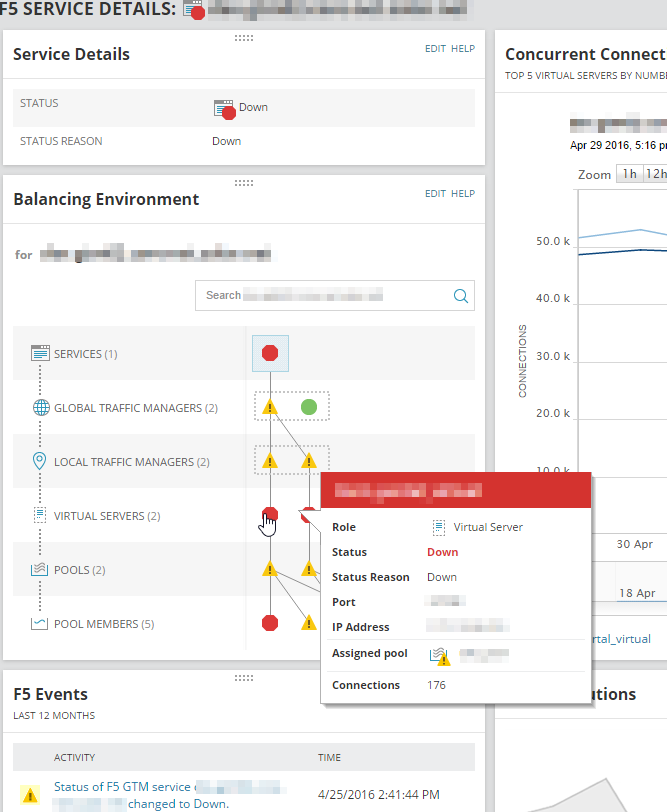
The light blue square in the Balancing Environment resource indicates your current position.
- The relational view of the load balancing environment sticks with us on the details page so we can continue to explore around. Select a virtual server, and click Display Details Page. This shows us the number of active connections for each pool member.
We can see the load balancing algorithm and how evenly it is distributing load.
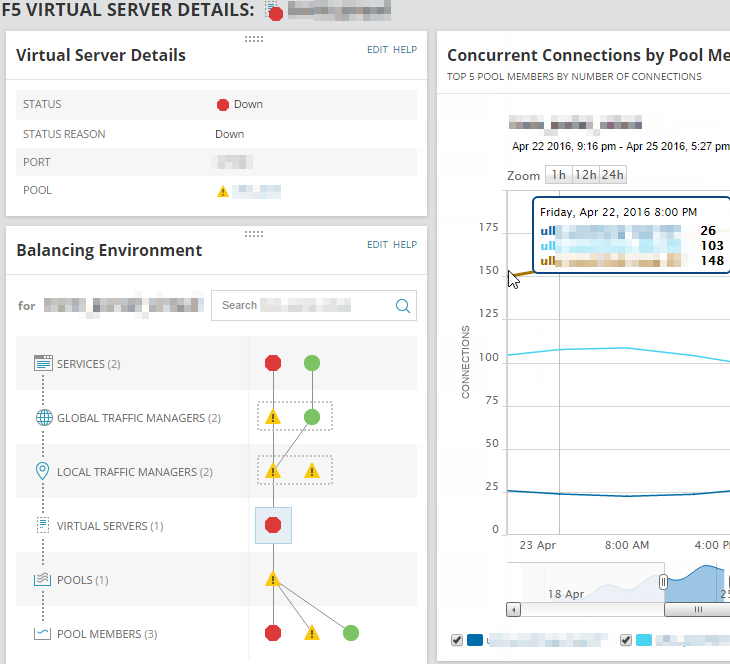
- Navigate through the load balancing environment to view the health of individual components.
- Drill in to the components with issues, review the data provided by NPM, such as the status of load balancing components and the reason why they are not up. Use the data to troubleshoot the issues.