Monitor Cisco ACI devices in NPM
Thanks to the broad coverage of Cisco OIDs, you can poll many statistics for hardware components that make up ACI, such as Nexus leaf and spine switches.
You can enable API polling on ACI devices to monitor the following components of your SDN environment:
- Tenants
- Application profiles
- Endpoint groups
- Spine and leaf switches
To get the best coverage of your ACI environment, enable the API polling on one of your APICs and add leaf and spine switches to NPM as SNMP nodes. To find out how to configure SNMP in APICs, see the Cisco document Configuring SNMP in APIC (© 2020 Cisco and/or its affiliates, obtained from https://www.cisco.com/c/en/us/td/docs/switches/datacenter/aci/apic/sw/all/mib/guide/b_Cisco_ACI_MIB_Quick_Reference/b_Cisco_ACI_MIB_Quick_Reference_chapter_01.html on February 26, 2020).
To monitor ACI-specific information, complete the following steps:
- Add an APIC node to NPM for monitoring, or enable ACI monitoring on an APIC node that is already monitored with NPM.
To add more ACI devices at the same time, see Discover your network with the Discovery Wizard, and then enable polling for Cisco ACI on one of the APICs.
- View members and their health scores on the device.
- View health score history in PerfStack
- View ACI environment on SolarWinds Platform Maps
Requirements
| Requirement | Details |
|---|---|
| ACI credentials | Cisco API Rest credentials for collecting health scores on ACI entities. REST API must be accessible from the main or additional polling engine server (depending on the polling engine used to poll the node) |
Add ACI devices and enable ACI polling
Add ACI devices for monitoring. If you have multiple APIC nodes in your ACI system, you can monitor all APIC nodes with NPM to collect health and performance data.
To collect health scores for your ACI environment, enable ACI polling on one of the APIC nodes. Each APIC has a full view of the ACI environment, and enabling ACI polling on multiple nodes thus results in polling and storing redundant information.
You need Node Management Rights. See Define what users can access and do.
- Select an APIC to poll for ACI details.
- Click Settings > All Settings, and click Add Node in the Getting Started grouping.
- Enter the IP address for the device.
- Select Most Devices: SNMP and ICMP as the polling method.
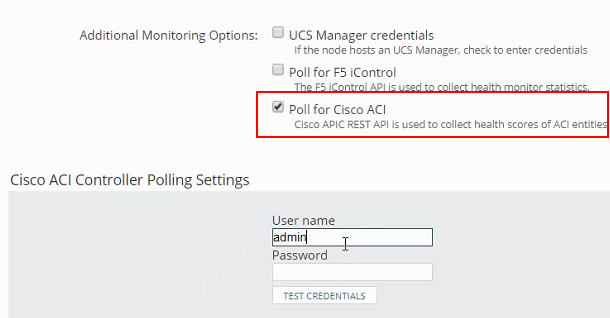
- Scroll down to Additional Monitoring Options, and select Poll for Cisco ACI.
- Provide the credentials for accessing the Cisco APIC REST API on the device, and click Test Credentials.
- Complete the Add Node wizard.
NPM now polls health scores for devices linked to the APIC, and calculates the ACI status based on the polled health score.
Enable polling for Cisco ACI on a monitored node
When the Cisco ACI devices are already monitored in NPM, make sure polling for ACI is enabled only on one of the APICs. Consider enabling ACI polling on the node with the least load or with the shortest response time.
Polling for Cisco ACI is used to collect health scores for ACI entities.
- Click Settings > Manage Nodes.
- Select the node, and click Edit Properties.
- Enable Cisco ACI polling.
- Click Submit.
Now you can see the Members subview with health score information for tenants and blades on the monitored device.
View health scores for ACI members
- In the SolarWinds Platform Web Console, go to the ACI node details view.
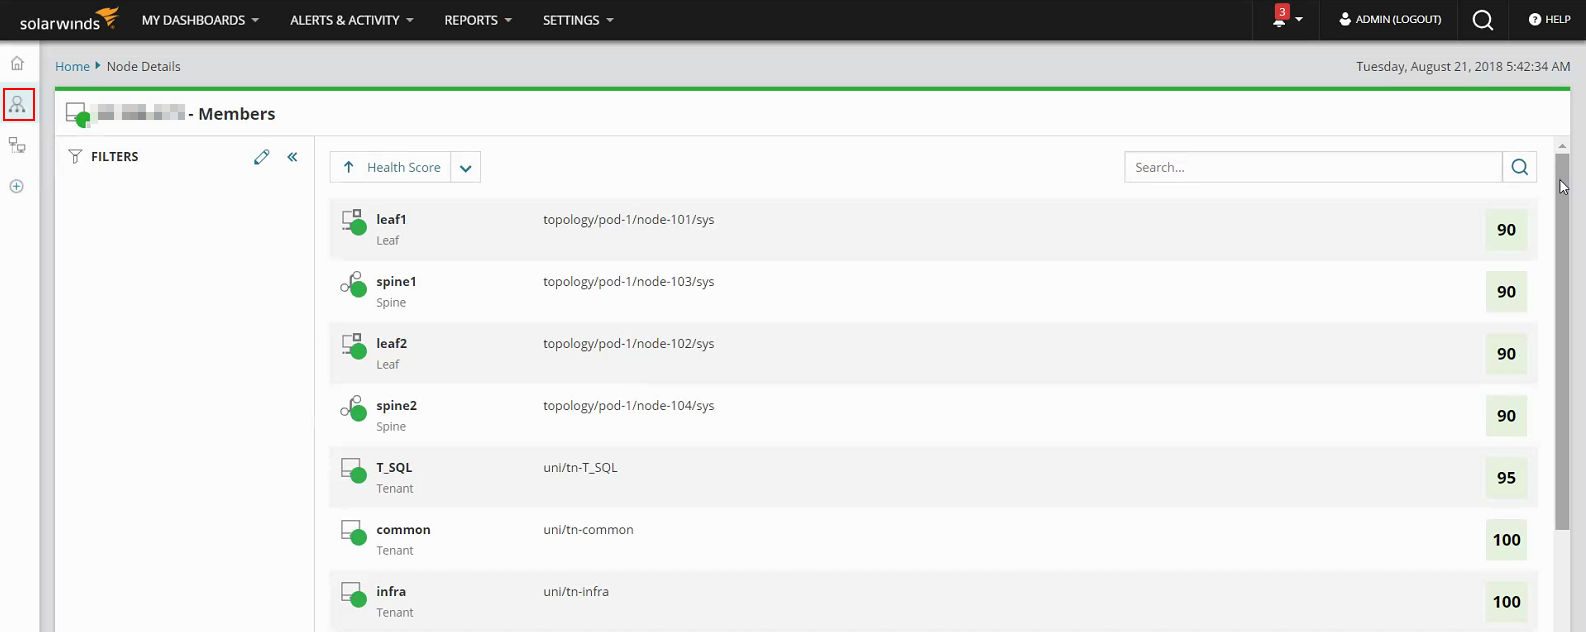
- Click the Members subview.
The Members subview displays the following items:
- Name
- Distinguished name
- Member type together with the type-specific icon
- Health score
ACI status uses thresholds defined on the APIC. The following table lists the default thresholds.
| 0-50 | critical status |
| 51-90 | warning status |
| 91-100 | up |
You can automatically display APIC members on the node on SolarWinds Platform Maps. Click the Map icon below in the navigation bar below the Members subview.
Use a part of the distinguished name to see child entities on a certain level (tenants or application profiles).
View health score and status history in PerfStack
Click a health score to open this metric as a new Performance Analysis Dashboard. In the PerfStack, you can see the health score and status of the ACI entity, including historical data.
View your SDN infrastructure on SolarWinds Platform Maps
- Go to the Node details for APIC view, and click the Map subview. The map shows only the node.
- In the Inspector panel on the left, select the ACI APIC for the node and click Apply to add it to the map.
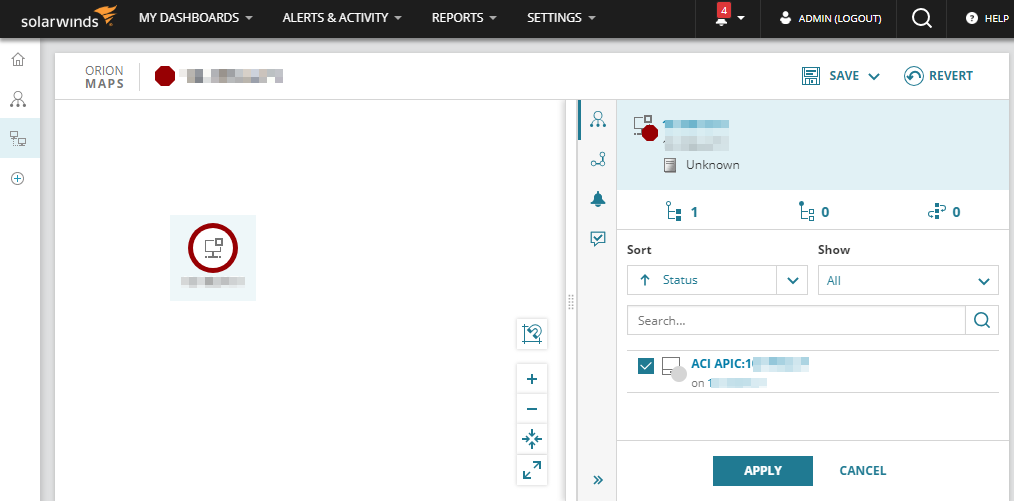
The APIC is added to the map. It represents the gate to the logical layer on your ACI.
- Select the ACI APIC on the map. The Inspector panel populates with all members on the APIC.
- Select the members in the Inspector panel, and click Apply to add them to the map. The members appear on the map.
You can now select entities or connections to display more details in the Inspector panel. Use the buttons on the map to apply different layouts, zoom in/out, center the map or extend it to the full screen. See SolarWinds Platform Maps for more details.
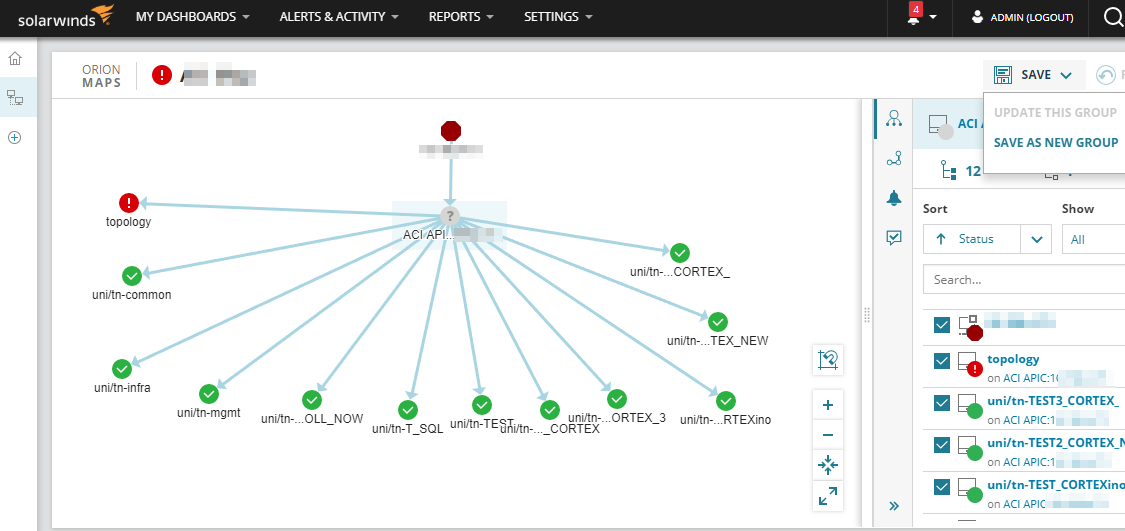
- To keep the map, save the objects as a group.
- Click Save > Save As New Group.
- Provide a name for the group.
The group is created and the Group Details view opens.
You can access the map at any time:
- Click My Dashboards > Groups, and then click the group name in the All Groups widget.
- When on the Group Details view, click the Map subview.