Search and filter historical event logs in LA
The Filters pane displays all filters you can apply to event messages. All filters are stored in groups. To apply a filter to the events table, click to expand a filter group, and then select a filter. The events table refreshes and displays the incoming events allowed by the filter conditions. Click the Hide Pane icon to collapse the pane, or the Show Pane icon to expand it.
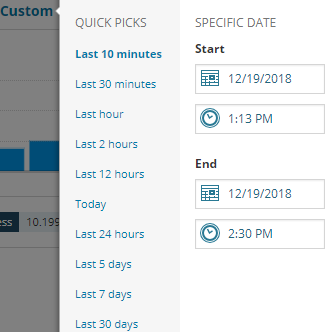
LA includes an advanced search capability to access your aggregated event logs based on applied filters and a specified range of time. To set your search parameters, select your log filters in the Filters pane, and then open the custom time picker to set your time frame
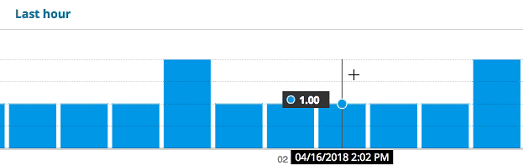
Enter a search term to return logs associated with your defined search criteria. The histogram chart also refreshes to present a graphical view of the number of logs processed during the designated time.
You can narrow your search based on a spike in log activity in one section of the histogram. To further refine your search results, drag your mouse pointer over a section of the histogram.
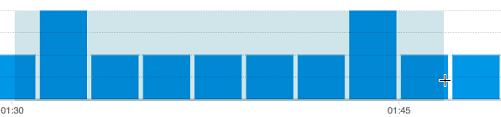
The histogram and log table both refresh to display logs within the selected time frame. At this point, you can also adjust your search filter to display key logs for that time, such as critical or alert events.