Enterprise Operation Console dashboards
New installations of EOC include pre-configured views under My Dashboards that you can use to monitor statuses, events, alerts, and hotspots across your entire deployment. You can further modify the default dashboards or customize the My Dashboards menu.
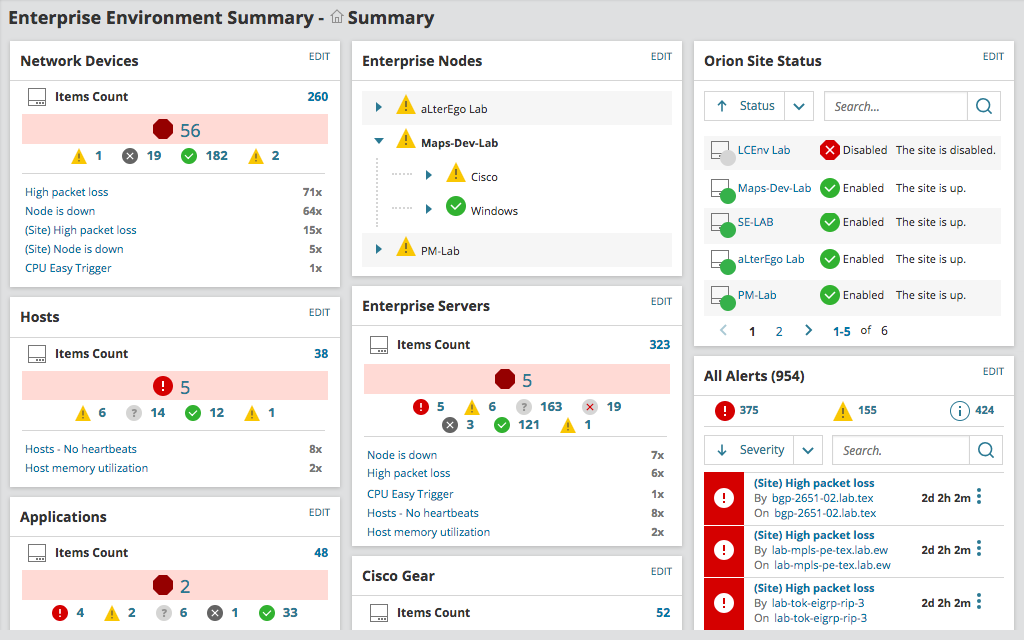
Environment Summary dashboard
The Enterprise Environment Summary dashboard is the default view when you first access the Enterprise Operations Console. This dashboard provides a high-level view of your SolarWinds Site Environment and displays a set of status widgets. Each widget presents status information for a set of SolarWinds Site entities as well as the top five alerts associated with those sites. You can add or delete widgets, as well as rearrange their layout and filter content.
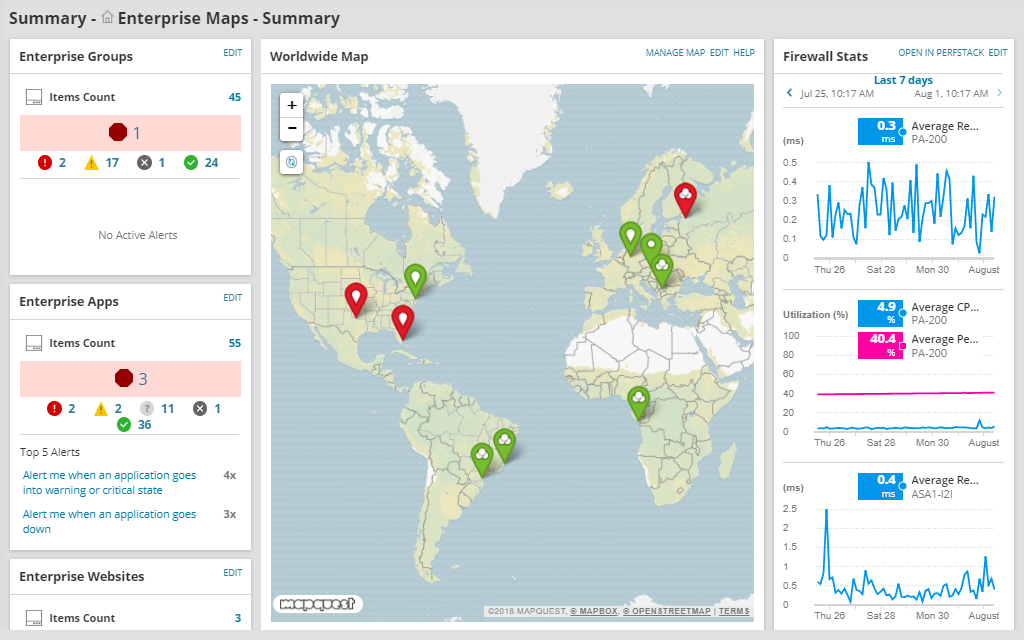
Enterprise Maps dashboard
The EOC Enterprise Maps dashboard is a visual representation of your environment across the globe with customized maps. You can view network link utilization between site locations in, for example, New York City and Singapore, as well as which location's links are down.
Performance Analysis dashboard
You can create analysis projects with the Performance Analysis (PerfStack™) dashboard. PerfStack visually correlates time series data from multiple SolarWinds products and entities in a single view. This allows you to:
- Troubleshoot issues in real time
- Create ad-hoc reports
- Identify root causes of intermittent issues
- Make data-driven decisions on infrastructure changes
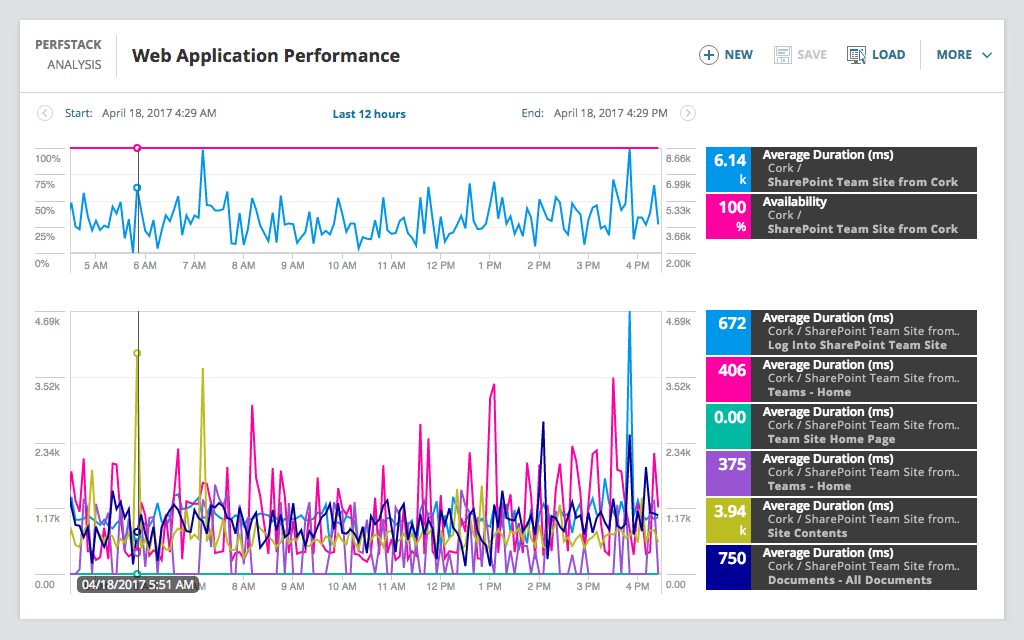
For more information about Performance Analysis, including how to create analysis projects in Enterprise Operations Console, see Troubleshooting environmental issues with Performance Analysis dashboards.
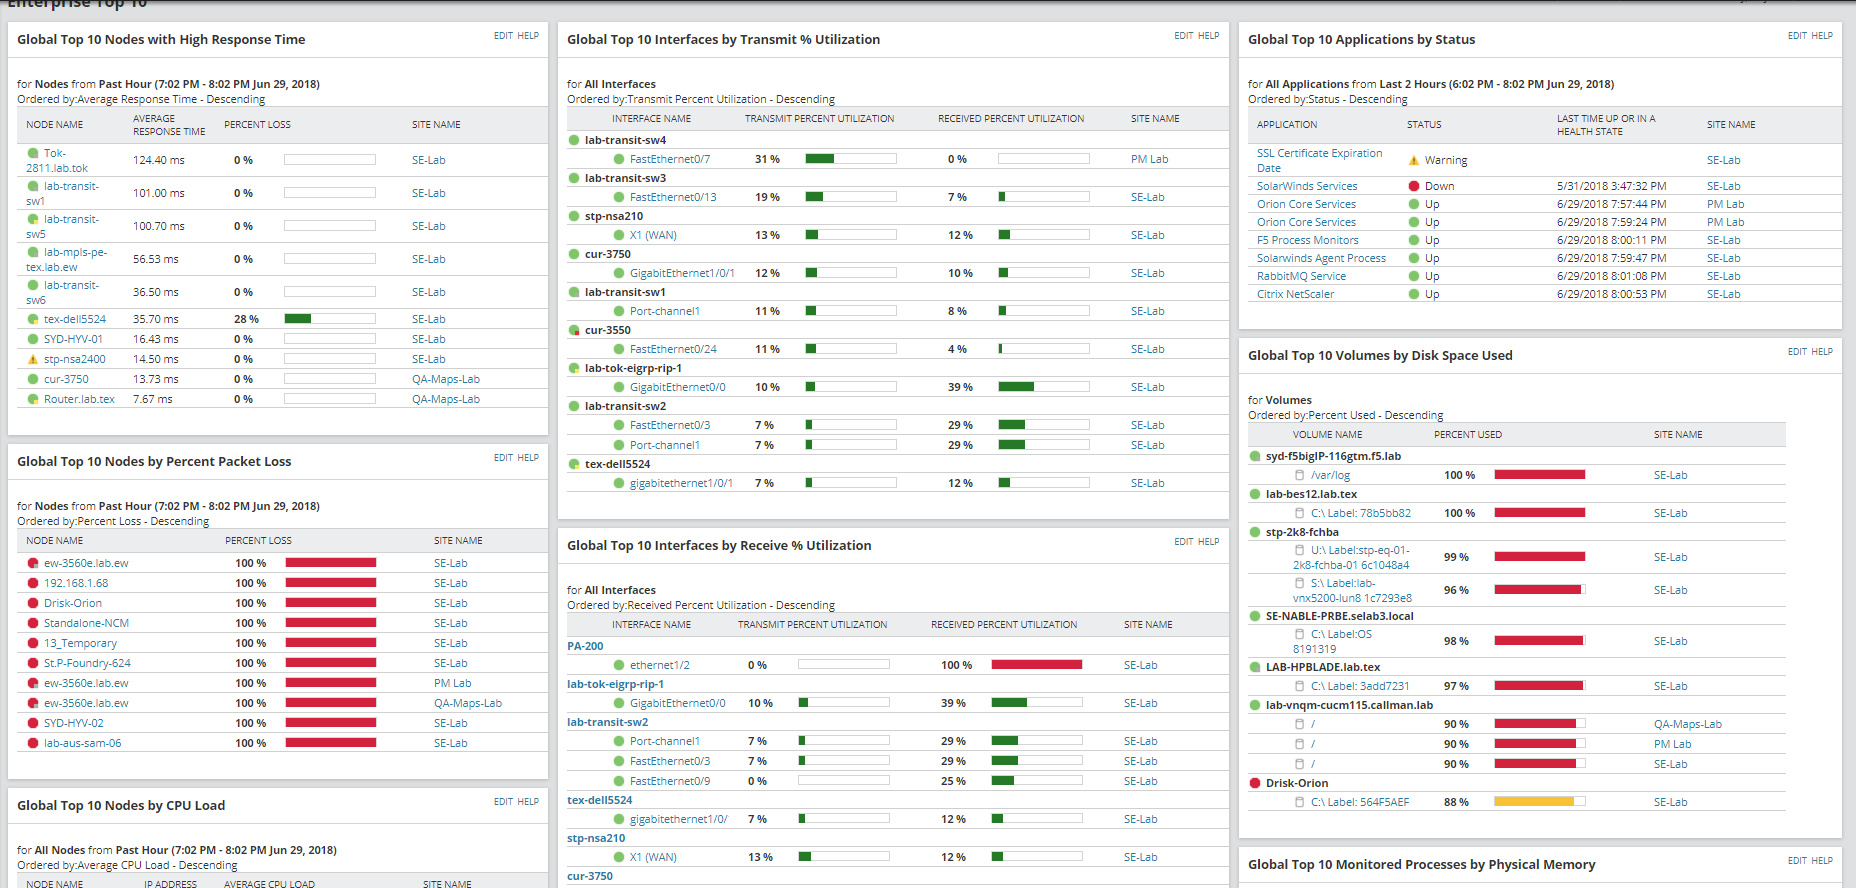
Enterprise Top 10 dashboard
The EOC Enterprise Top 10 dashboard provides you with quick insight into critical site statuses, problem areas, and hotspots across your network environment.
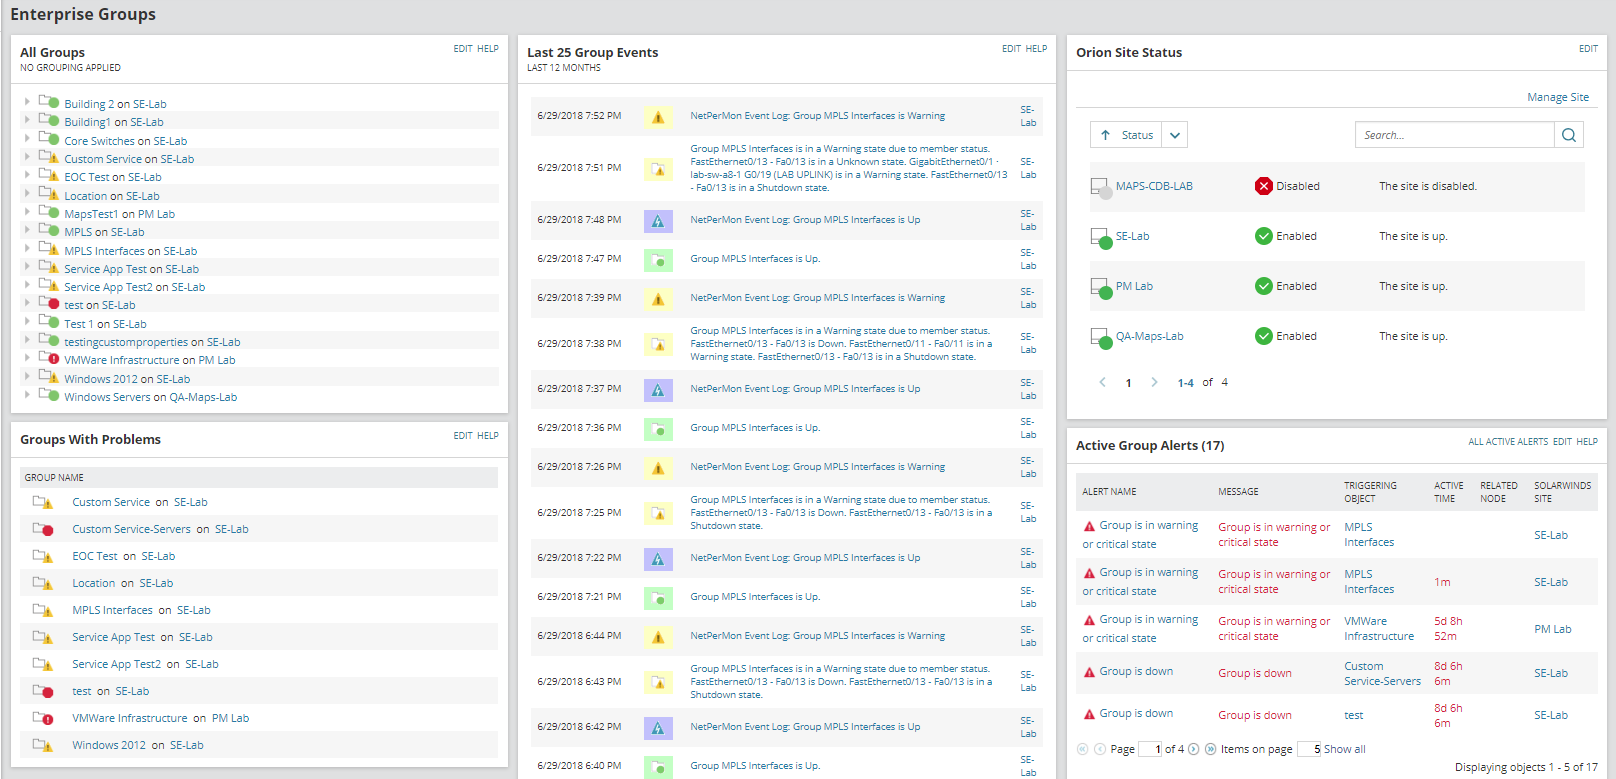
Enterprise Groups dashboard
The EOC Enterprise Groups dashboard allows you to quickly pinpoint entity group statuses, alerts, and events from all of your configured groups across deployments.